A tooltip chart is a chart with tooltips that appear when users hover over items within it.
Usage
For charts that have more than one data set graphed, a complex chart tooltip can be used to give more detail to a specific point in the multiple data series. This works well for line, area, or stacked charts, where data sets may intersect over a period of time.
Example
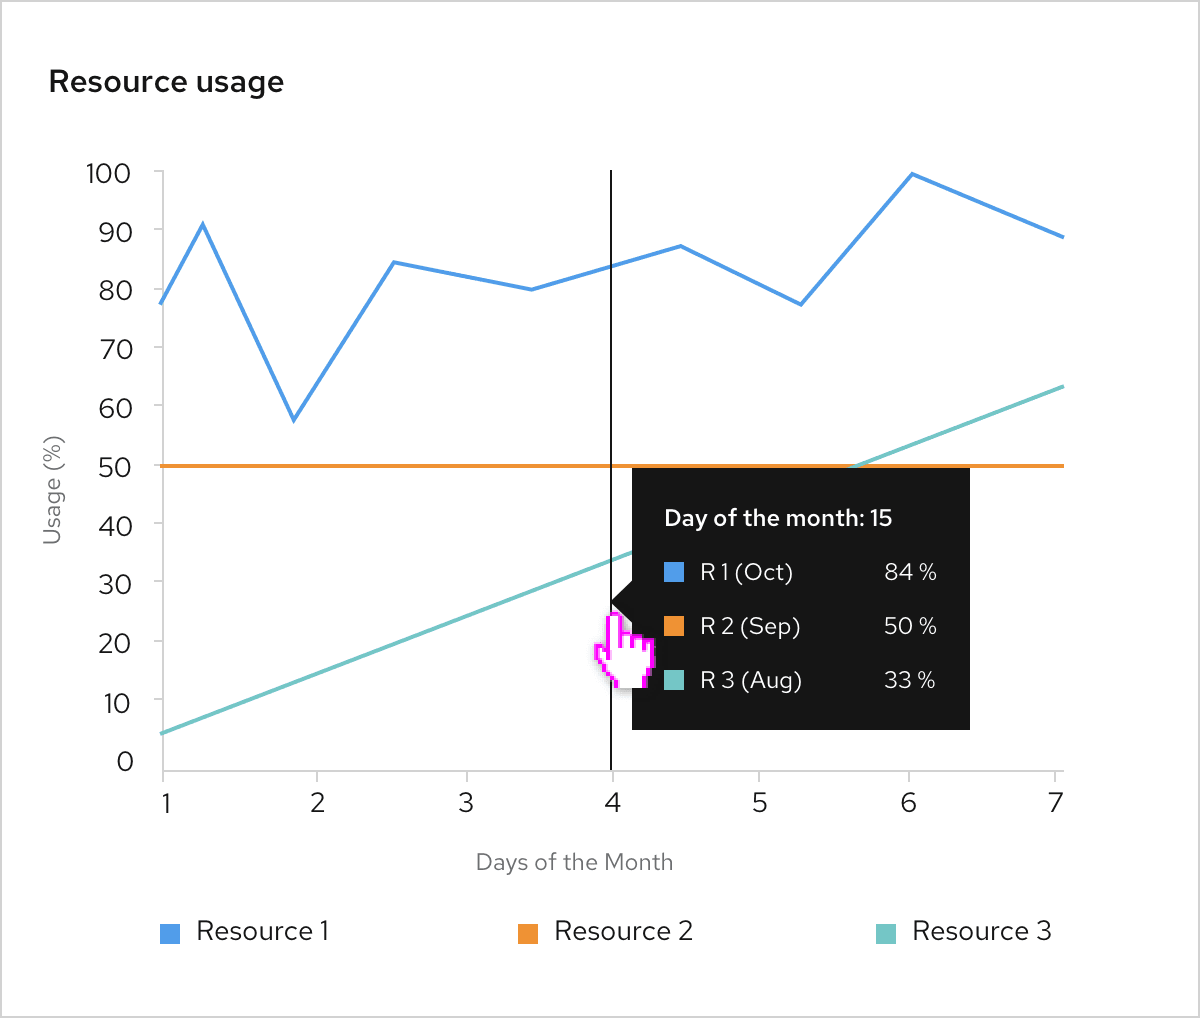
On hover, the tooltip shows all the corresponding data points that match a point along the x-axis. Tooltip content could also include any additional information that might be important to the user.